The cold start is Lambda's most visible flaw and its most poorly treated one. Many teams discover it in production, apply the first remedy found in a blog post, then learn to live with it. Here is the method we follow, in the order it pays off, and what it delivered on the API of a B2B cloud marketplace: cold starts brought down from about 8 s to about 1.5 s.
Measure at the p99 before touching anything
A cold start does not show up in average latency. On an API with sustained traffic, the vast majority of invocations hit an instance that is already initialized; cold starts concentrate in the tail of the distribution. Optimizing without looking at the p99 means knowing neither where you started from nor whether the fix achieved anything. Yet that is how most of these efforts begin: someone saw a slow request, someone else read an article about provisioned concurrency, and the link between the two was never demonstrated.
Everything is already in CloudWatch. Every cold start writes an initDuration field in the invocation's REPORT line. A Logs Insights query gives the frequency and the distribution:
filter @type = "REPORT" and ispresent(@initDuration)
| stats count(*) as coldStarts,
        avg(@initDuration) as initAvg,
        pct(@initDuration, 99) as initP99
  by bin(1h)
The same query without the filter gives the total invocation volume; the ratio between the two is the first number that matters. A function invoked continuously rarely starts cold; a function invoked a few times per hour starts cold almost every time. The same init p99 does not carry the same weight in both cases, and neither does the work that follows.
This is also the moment to triage. Synchronous paths exposed to a user deserve the effort; asynchronous workers and scheduled jobs cope perfectly well with a second of initialization that nobody is waiting for. We have seen weeks disappear into optimizing functions whose only consumer was a perfectly patient SQS queue.
Memory is a CPU setting in disguise
Lambda allocates CPU proportionally to memory: around 1,769 MB, the function gets a full vCPU. And the initialization phase is almost always CPU-bound: parsing the code, loading modules, opening connections. A function left at 128 MB initializes the same code with a fraction of a vCPU, and that is paid for directly in cold start duration.
Raising memory is therefore often the first win, and it is counter-intuitive: the function costs more per millisecond but runs for less time, and the bill barely moves, sometimes in the right direction. AWS Lambda Power Tuning automates the search for the sweet spot by running the real function across a range of configurations. We run it on every critical function rather than debating it in a meeting.
The bundle: where we gained the most
On the marketplace API, the main lever was neither memory nor provisioned concurrency: it was the size and shape of the code loaded at initialization. Three workstreams, tackled in this order:
- Bundling with esbuild. Going from
node_modulesdeployed as-is to a single minified, tree-shaken bundle changes the nature of the problem: the runtime no longer resolves thousands of files, it loads one. - Dependency pruning. Every dependency has to justify its weight at init. An entire library imported to format a date, a full HTTP client where
fetchis enough: that is hundreds of milliseconds paid on every start, for nothing. - Loading SDK clients on demand. Instantiating every AWS client at module level is paid for at cold start, including on routes that use none of them. We moved instantiation to first use, route by route, measuring each time. It is a deliberate trade-off: the first affected request pays the price, and you have to decide where that price is acceptable.
The esbuild configuration that carries most of the gain fits in one command:
esbuild src/handler.ts --bundle --minify \
  --platform=node --target=node22 \
  --external:@aws-sdk/* --outfile=dist/handler.js
That combination of bundling, pruning and lazy loading took cold starts from about 8 s to about 1.5 s. Not a single line of business logic changed. This is the point we repeat most often: before buying capacity to mask a slow initialization, check what that initialization actually does.
Do your cold starts exceed one second? Describe your system: a one-page diagnosis within 48 hours.
Get my diagnosis →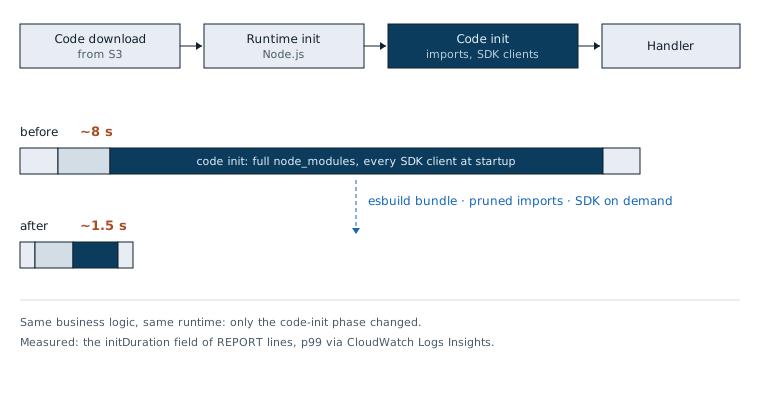
Provisioned concurrency: only where users feel it
Provisioned concurrency works: initialized instances wait for traffic, and the cold start disappears on those instances. But it is billed continuously, traffic or not, and it has a perverse effect: it makes the problem invisible without fixing it. The day traffic exceeds the provisioned capacity, the excess invocations get the original cold start back, intact, at the worst possible moment since it is a spike.
Our rule: first reduce the real cold start through the bundle and memory, then provision, and only on the synchronous paths users are actually waiting on, an authentication, a search, a payment. Never on workers. With Application Auto Scaling, provisioned capacity can follow a schedule: high during business hours, minimal at night. That is the difference between a controlled cost and a billing line that swells in silence.
The runtime weighs more than we like to admit
Node and Python initialize fast. Java and .NET carry a virtual machine and frameworks that are paid for in full at initialization; on the JVM, SnapStart restores a snapshot of an already initialized runtime and genuinely changes the game, provided you handle the restore pitfalls, random number generators and connections in particular.
But let us be honest about the scope of this advice: you do not switch runtimes to save cold start time. The roughly 28 Lambda microservices we built and operated on that platform were in Node and TypeScript, and it was the bundle, not the language, that made the difference. The choice of runtime is a team and ecosystem choice; the cold start is one criterion among others, rarely the first. In passing, a myth to bury: placing a function in a VPC no longer adds the seconds it once did, as AWS has long since shared network interface attachment across functions.
The trap of DIY warming
The classic temptation: an EventBridge rule that pings the function every five minutes to keep it warm. We have come across it on almost every project we have taken over, and we systematically advise against it.
- A ping keeps one instance warm. As soon as two requests arrive in parallel, the second one triggers a full cold start. The hack gives the illusion of having dealt with the problem when it only covers the lightest traffic.
- The handler has to recognize the pings and short-circuit them: plumbing that gets duplicated in every function and ends up leaking into the metrics.
- The underlying problem, a bloated bundle or heavyweight init work, remains untouched. It resurfaces at every deployment, every traffic ramp-up, every new function.
A ping every five minutes keeps one instance warm. Your traffic spike calls for twenty.
If the need to keep instances warm is real, that is exactly what provisioned concurrency does cleanly, with guarantees and explicit billing. DIY warming is the fragile version of the same purchase, without the guarantees.
The order that pays off
- Measure: proportion of cold starts and
initDurationp99, function by function. - Triage: only work on the synchronous paths users are waiting on.
- Size the memory with Power Tuning, not by guesswork.
- Shrink the bundle: esbuild, dependency pruning, on-demand SDK loading.
- Provision concurrency on the few critical endpoints only, after everything else.
- Do not install DIY warming, and dismantle any that exists.
- Re-measure, and keep the Logs Insights query in a permanent dashboard.
The cold start is only one bottleneck among others. The approach stays the same when facing a slow SQL query, an endless reindexing or an API buckling under traffic: profile, fix the biggest cost, prove the gain, start again. That is how we run every performance optimization engagement.